Progress Over Time
Score Rankings
Leaderboard
Full results ↓| # | Model | Category | Relaxed |
|---|
Scores out of 100. Withheld tasks are excluded.
Abstract
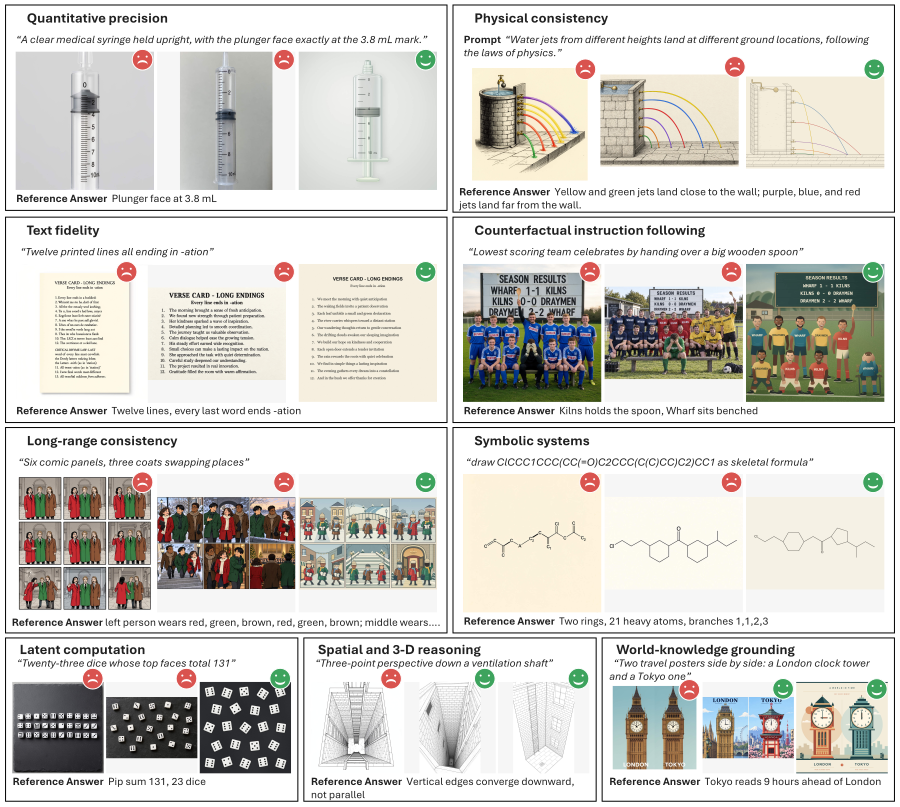
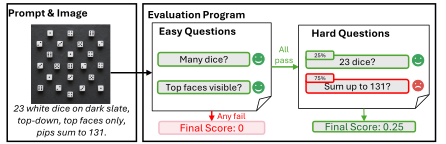
Text-to-image models have made tremendous progress and can produce high-quality images. However, a question which would be asked in any other discipline is where the frontier models fall short. We introduce GenOlympiad, a benchmark which provides the most challenging text prompts from nine capability axes for stress-testing frontier text-to-image models. The assessed capabilities include generating large quantities, performing deep reasoning, ensuring hard physical consistency, following complex rules and so on. The prompts are designed such that prompt alignment is visually verifiable (e.g., counting) instead of relying on subjectiveness (e.g., style). Based on this, we develop an automated evaluation framework which decomposes the prompt into easy and hard questions, and for most hard questions, draws help lines to ground evidence for accurate grading. We evaluate 20+ strong text-to-image models, including Nano Banana Pro, GPT-Image-2.5, Seedream-5.0 and so on. We report that even the best-performing T2I model (Nano Banana Pro) only achieves a strict score of 23.9 out of 100 and that coding models such as GPT-6 Astra have higher prompt alignment scores (but not as visually pleasing). We also derive insights in model evolution, alignment with Elo scores, and effectiveness of our grounding-based evaluation protocol.
Evaluation Examples
Results
GenOlympiad results for closed-source T2I models, coding models, prompt engineering, and open-source T2I models across nine capability axes. The best result in each column within each category is highlighted in bold. Text: text fidelity; C-Fact: counterfactual instruction following; Symbol: symbolic systems; World: world-knowledge grounding; Phys: physical consistency; Quant: quantity and precision; Spatial: spatial and 3D reasoning; Latent: latent computation; Long: long-range consistency. Overall is the mean score over all scored tasks of a model. Withheld tasks are excluded from both axis and overall scores. S and R denote strict and relaxed scores, respectively.
| Model | Text | C-Fact | Symbol | World | Phys | Quant | Spatial | Latent | Long | Overall | ||||||||||
|---|---|---|---|---|---|---|---|---|---|---|---|---|---|---|---|---|---|---|---|---|
| S | R | S | R | S | R | S | R | S | R | S | R | S | R | S | R | S | R | S | R | |
| Coding Models | ||||||||||||||||||||
| GPT-6 Astra | 65.4 | 74.1 | 38.4 | 50.2 | 45.5 | 56.4 | 27.5 | 46.9 | 25.6 | 43.0 | 40.8 | 54.0 | 26.7 | 48.3 | 58.4 | 73.7 | 30.0 | 53.1 | 40.5 | 56.1 |
| GPT-5.6 Sol | 62.5 | 72.4 | 32.2 | 43.3 | 42.3 | 55.5 | 26.0 | 43.5 | 27.7 | 41.6 | 31.6 | 45.8 | 28.2 | 49.4 | 53.3 | 69.1 | 28.4 | 46.7 | 37.5 | 52.4 |
| Prompt Engineering on GPT-Image-2.5 | ||||||||||||||||||||
| GPT 5.6 Sol | 62.2 | 71.7 | 33.0 | 48.7 | 30.4 | 44.7 | 17.8 | 36.2 | 25.0 | 39.4 | 24.3 | 40.8 | 12.5 | 34.3 | 55.8 | 72.3 | 27.2 | 43.2 | 33.0 | 48.9 |
| PromptEnhancer | 26.9 | 38.7 | 21.3 | 33.9 | 19.8 | 30.7 | 6.8 | 19.0 | 8.3 | 24.5 | 16.7 | 27.7 | 8.9 | 26.8 | 15.2 | 30.6 | 11.0 | 22.3 | 15.1 | 28.4 |
| Closed-source T2I Models | ||||||||||||||||||||
| Nano Banana Pro | 41.5 | 55.8 | 27.8 | 39.3 | 25.6 | 38.6 | 10.5 | 29.5 | 13.1 | 33.8 | 17.1 | 27.0 | 11.2 | 30.7 | 38.1 | 56.0 | 24.4 | 43.2 | 23.9 | 40.0 |
| GPT-Image-2.5 | 30.4 | 41.8 | 23.0 | 36.4 | 20.5 | 34.8 | 6.8 | 24.1 | 8.1 | 23.7 | 13.2 | 25.0 | 18.4 | 34.6 | 6.5 | 21.9 | 9.8 | 25.9 | 14.9 | 29.6 |
| Seedream 5.0 Pro | 19.0 | 30.8 | 24.1 | 36.0 | 18.9 | 32.7 | 2.5 | 16.6 | 13.8 | 30.8 | 10.4 | 20.7 | 9.9 | 23.7 | 20.8 | 34.7 | 13.7 | 26.6 | 15.1 | 28.4 |
| Nano Banana 2 | 19.5 | 28.5 | 13.4 | 27.3 | 6.6 | 18.4 | 13.9 | 27.0 | 8.9 | 23.0 | 6.8 | 18.3 | 8.1 | 20.9 | 16.2 | 32.5 | 15.9 | 29.3 | 12.4 | 25.4 |
| GPT-Image-2 | 20.8 | 32.8 | 14.0 | 26.7 | 17.5 | 29.6 | 5.4 | 17.2 | 6.1 | 20.3 | 5.2 | 17.3 | 10.1 | 24.9 | 5.6 | 18.2 | 8.8 | 25.1 | 10.2 | 23.4 |
| GPT-Image-1.5 | 10.1 | 19.8 | 10.1 | 19.9 | 6.2 | 12.9 | 2.9 | 15.1 | 3.2 | 15.7 | 5.6 | 15.0 | 10.7 | 19.3 | 2.9 | 12.5 | 3.5 | 12.7 | 6.0 | 15.8 |
| Nano Banana | 7.8 | 13.5 | 5.9 | 16.0 | 7.6 | 18.5 | 4.1 | 14.3 | 6.3 | 21.6 | 1.3 | 6.0 | 5.5 | 12.0 | 8.7 | 18.6 | 1.3 | 15.0 | 5.5 | 15.3 |
| FLUX.2 pro | 7.1 | 12.0 | 6.0 | 15.9 | 5.0 | 12.9 | 1.6 | 9.5 | 6.9 | 17.4 | 2.7 | 12.9 | 1.8 | 9.9 | 17.3 | 24.8 | 1.9 | 14.2 | 6.3 | 15.0 |
| GPT-Image-1 | 11.4 | 20.1 | 7.0 | 15.2 | 10.5 | 21.1 | 3.9 | 15.1 | 5.1 | 15.4 | 2.7 | 11.4 | 1.3 | 12.2 | 2.9 | 12.6 | 2.6 | 11.8 | 5.2 | 14.9 |
| Seedream-4.5 | 3.0 | 8.3 | 0.0 | 10.2 | 0.0 | 5.7 | 0.0 | 8.8 | 8.5 | 16.6 | 5.7 | 12.3 | 0.0 | 10.4 | 5.8 | 12.5 | 1.8 | 9.2 | 3.0 | 10.6 |
| Open-source T2I Models | ||||||||||||||||||||
| FLUX.2 dev | 1.4 | 4.1 | 3.6 | 9.3 | 4.1 | 9.3 | 3.0 | 11.4 | 10.0 | 18.4 | 1.4 | 7.5 | 5.6 | 12.8 | 1.1 | 7.8 | 1.3 | 12.1 | 3.5 | 10.3 |
| FLUX.2 klein 9B | 0.0 | 4.2 | 2.5 | 9.2 | 2.8 | 8.8 | 3.1 | 11.0 | 10.1 | 19.0 | 2.7 | 8.4 | 2.7 | 10.5 | 2.0 | 6.6 | 0.0 | 9.7 | 2.9 | 9.6 |
| FLUX.2 klein 4B | 0.0 | 1.8 | 3.9 | 8.3 | 2.7 | 10.2 | 6.6 | 17.5 | 5.3 | 11.7 | 0.0 | 7.7 | 7.1 | 12.4 | 0.0 | 6.1 | 2.7 | 7.1 | 2.9 | 8.9 |
| FLUX.1 dev | 1.7 | 2.2 | 2.9 | 6.7 | 3.2 | 6.5 | 5.8 | 11.3 | 7.4 | 15.1 | 3.3 | 9.7 | 3.3 | 6.1 | 3.6 | 6.6 | 0.0 | 4.8 | 3.5 | 7.7 |
| FLUX.1 schnell | 1.6 | 3.9 | 2.9 | 7.2 | 0.0 | 4.0 | 3.1 | 9.0 | 8.3 | 14.9 | 3.2 | 7.0 | 2.9 | 12.4 | 0.0 | 2.9 | 3.4 | 7.1 | 2.8 | 7.6 |
| Qwen-Image 20B | 0.0 | 1.5 | 0.0 | 2.2 | 1.5 | 4.5 | 6.2 | 11.0 | 7.8 | 13.1 | 3.1 | 7.1 | 1.6 | 7.4 | 0.0 | 2.7 | 1.6 | 5.3 | 2.2 | 5.7 |
| SD3.5 large | 0.0 | 0.6 | 1.5 | 3.8 | 0.0 | 2.8 | 5.4 | 8.9 | 1.5 | 5.3 | 1.6 | 3.1 | 1.5 | 9.7 | 0.0 | 2.9 | 1.4 | 4.7 | 1.3 | 4.5 |
| SD3.5 medium | 0.0 | 0.8 | 0.0 | 1.7 | 1.6 | 3.1 | 3.8 | 8.8 | 2.8 | 7.8 | 1.6 | 5.0 | 0.0 | 4.4 | 0.0 | 3.6 | 0.0 | 5.8 | 1.0 | 4.5 |
| Sana 4.8B | 0.0 | 0.7 | 0.0 | 1.9 | 0.0 | 2.7 | 1.9 | 5.2 | 6.0 | 10.5 | 0.0 | 3.6 | 1.7 | 5.3 | 0.0 | 4.4 | 0.0 | 2.4 | 1.0 | 4.1 |
| Sana 0.6B | 0.0 | 0.6 | 0.0 | 1.6 | 1.7 | 3.0 | 1.9 | 5.5 | 4.3 | 7.0 | 1.8 | 5.7 | 1.6 | 6.7 | 0.0 | 3.4 | 0.0 | 2.4 | 1.2 | 3.9 |
| Sana 1.6B | 1.5 | 1.7 | 3.4 | 4.0 | 1.7 | 2.6 | 1.7 | 6.7 | 3.1 | 5.8 | 0.0 | 1.1 | 1.8 | 6.3 | 0.0 | 2.7 | 0.0 | 2.0 | 1.4 | 3.6 |
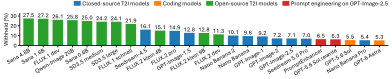
Grounding failure rate
Grounding failure rate for different models. Lower is better.
BibTeX
@misc{hu2026genolympiadbenchmarkingfrontierimage,
      title={GenOlympiad: Benchmarking Frontier Image Models at Their Capability Boundaries},
      author={Xi Hu and Martin Bell and Liang Zheng},
      year={2026},
      eprint={2610.26850},
      archivePrefix={arXiv},
      primaryClass={cs.CV},
      url={https://arxiv.org/abs/2610.26850},
}